Maria Mendez Case Scenario
Maria Mendez, CFA, is a research analyst at Three-Star Investment Management. Mendez is collecting and analyzing data as part of a project to explain and forecast Three-Star’s portfolio returns using arbitrage pricing theory (APT). Mendez begins by collecting 5 years of monthly data including: 1) surprise in GDP growth (GDP) and 2) surprise in inflation (INF) to use in explaining portfolio returns.
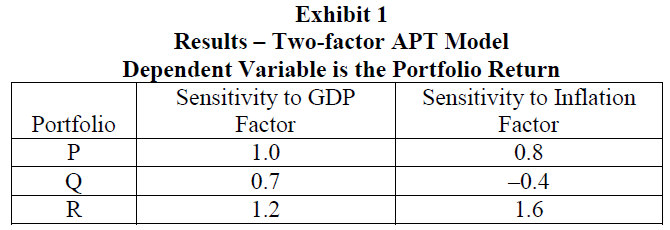
Mendez estimates a two-factor APT model and obtains the results shown in Exhibit 1.

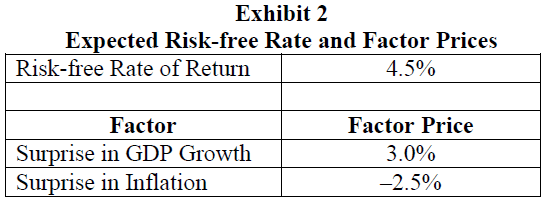
Mendez shares her results with Andy Benoit, her supervisor and a portfolio manager. He is interested in computing forecasted portfolio returns given his expectations for factor prices and the risk free rate shown in Exhibit 2. He also wants to know the expected return for a new portfolio that will be comprised of equal parts of Portfolios Q and R.

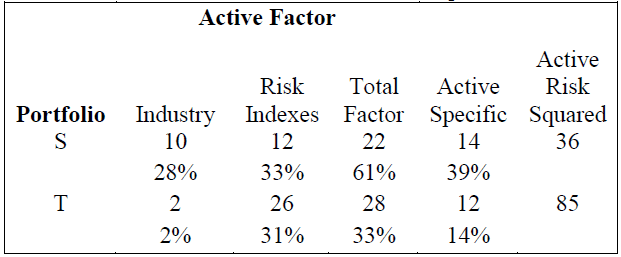
Benoit is also interested in comparing active risk between two of his other portfolios. He asks Mendez to estimate the BARRA US-E3 factor model which incorporates industry categories and risk indexes. The results of the active risk analysis are presented in Exhibit 3. Based on her results, Mendez computes information ratios for Portfolios S and T equal to 0.25 and 0.55, respectively.

55. The model estimated in Exhibit 1 is most accurately described as a:
A. statistical factor model.
B. factor sensitivity model.
C. macroeconomic factor model.
Answer: C
“Portfolio Concepts,” Richard A. Defusco, Dennis W. McLeavey, Jerald E. Pinto, and David E. Runkel 2009 Modular Level II, Volume 6, pp. 378-379 Study Session 18-66-j, l Discuss and compare macroeconomic factor models, fundamental factor models, and statistical factor models.
Discuss the arbitrage pricing theory (APT), including its underlying assumptions and its relation to the multifactor models, calculate the expected return on an asset given an asset’s factor sensitivities and the factor risk premiums, and determine whether an arbitrage opportunity exists, including how to exploit the opportunity. The model estimated in Exhibit 1 is a macroeconomic factor model. In macroeconomic factor models, the factors are surprises in macroeconomic variables that significantly explain equity returns.
56. Given the model estimated in Exhibit 1, the expected return on Portfolio P is closest to:
A. 4.40%.
B. 5.50%.
C. 6.80%.
Answer: B
“Portfolio Concepts,” Richard A. Defusco, Dennis W. McLeavey, Jerald E. Pinto, and David E. Runkel
2009 Modular Level II, Volume 6, pp. 382-388 Study Session 18-66-l Discuss the arbitrage pricing theory (APT), including its underlying assumptions and its relation to the multifactor models, calculate the expected return on an asset given an asset’s factor sensitivities and the factor risk premiums, and determine whether an arbitrage opportunity exists, including how to exploit the opportunity. The expected return on Portfolio P is: E(Rp) = RF + λ1βp,GDP + λ2βp,INF = 4.5 + (3.0 × 1.0) + (–2.5 × 0.8) = 5.50%
57. Given the model estimated in Exhibit 1, the expected return on Benoit’s new portfolio combining Portfolios Q and R is closest to:
A. 5.85%.
B. 7.20%.
C. 7.70%.
Answer: A
“Portfolio Concepts,” Richard A. Defusco, Dennis W. McLeavey, Jerald E. Pinto, and David E. Runkel 2009 Modular Level II, Volume 6, pp. 382-388 Study Session 18-66-l Discuss the arbitrage pricing theory (APT), including its underlying assumptions and its relation to the multifactor models, calculate the expected return on an asset given an asset’s factor sensitivities and the factor risk premiums, and determine whether an arbitrage opportunity exists, including how to exploit the opportunity.
The expected return on an equal combination of Portfolios Q and R is: E(Rp) = RF + λ1βp,GDP + λ2βp,INF = 4.5 + [3.0 × (0.7+1.2)/2] + [–2.5 × (–0.4+1.6)/2] = 5.85%
58. Based on the results reported in Exhibit 3, the tracking risk for Portfolios S is closest to:
A. 3.7%.
B. 4.7%.
C. 6.0%.
Answer: C
“Portfolio Concepts,” Richard A. Defusco, Dennis W. McLeavey, Jerald E. Pinto, and David E. Runkel 2009 Modular Level II, Volume 6, pp. 402-406
Study Session 18-66-m Explain the sources of active risk, and define and interpret tracking error, tracking risk, and the information ratio, and explain factor portfolio and tracking portfolio. Tracking risk is the square root of Active Risk Squared. Portfolio S tracking risk = 360.5 = 6.0%.
59. Based on the analysis reported in Exhibit 3, the most appropriate conclusions regarding the active risk analysis of the two portfolios is that:
A. portfolio S assumed higher total factor risk and active specific risk.
B. portfolio T had higher active bets on the risk indexes and higher total factor risk.
C. portfolio S had lower active bets on the risk indexes and lower active specific risk.
Answer: A
“Portfolio Concepts,” Richard A. Defusco, Dennis W. McLeavey, Jerald E. Pinto, and David E. Runkel 2009 Modular Level II, Volume 6, pp. 402-406 Study Session 18-66-m Explain the sources of active risk, define and interpret tracking error, tracking risk and the information ratio, and explain factor portfolio and tracking portfolio. In order to answer this question you must first determine the proportional contributions of the various sources of risk relative to active risk squared.

This table shows that portfolio S assumed higher total factor risk and active specific risk.
60. Given the information ratios computed by Mendez, the most appropriate conclusion regarding the performance of the two portfolios is that, relative to Portfolio S, Portfolio T experienced:
A. less active risk.
B. more risk per unit of return.
C. superior risk-adjusted performance.
Answer: C
“Portfolio Concepts,” Richard A. Defusco, Dennis W. McLeavey, Jerald E. Pinto, and David E. Runkel 2009 Modular Level II, Volume 6, pp. 402-403 Study Session 18-66-m Explain the sources of active risk, define and interpret tracking error, tracking risk and the information ratio, and explain factor portfolio and tracking portfolio. The information ratio is the ratio of mean active return to active risk. The higher the information ratio, the better is the risk-adjusted performance of the portfolio. Because Portfolio T had a higher information ratio, it experienced superior risk-adjusted performance
. |

